

Growth Ritual #81
📋 In This Issue:
AI Adoption Isn't Declining. You're Just Reading the Wrong Chart
Welcome to Phase 2 of the AI Revolution. Phase 1 Skills Don't Apply — 🔒
We're Chasing the Wrong Kind of AI. Brain Science Shows Why — 🔒
Forget Revenue Per Employee. The Real AI Metric is "Zombie Work" — 🔒
Know someone who’d love this? Invite them and you’ll both win—your friend discovers the newsletter, and you unlock 1 month of premium access.
AI Adoption Isn't Declining. You're Just Reading the Wrong Chart
The genius of The Simpsons has always been its ability to embed deep, complex issues within the simplest of ironic jokes. It's a masterclass in social commentary.
A classic example that always sticks with me comes from Season 5. Pinned down by irrefutable evidence of his guilt, Homer offers this desperate, last-ditch defense:
'You know, people can come up with statistics to prove anything. 40% of people know that.'
I'm starting with this for a reason. The chorus of voices declaring the AI boom 'over' has just found its new favorite statistic to prove its point.
Last week we picked apart the misleading MIT "AI declining" report. This week, the panic got a new poster child: a viral chart from Apollo showing a steep decline in AI adoption at large companies.
The narrative is growing that the party's over. My inbox lit up again. Founders are getting spooked.
This is another classic case of lies, damned lies, and statistics. So let's break down why this chart is statistical junk food and find the real nutrition underneath.
The Chart That Spooked the Market
First, let's look at the data that caused the panic.
It’s the chart from Apollo, based on the U.S. Census Bureau's BTOS survey.
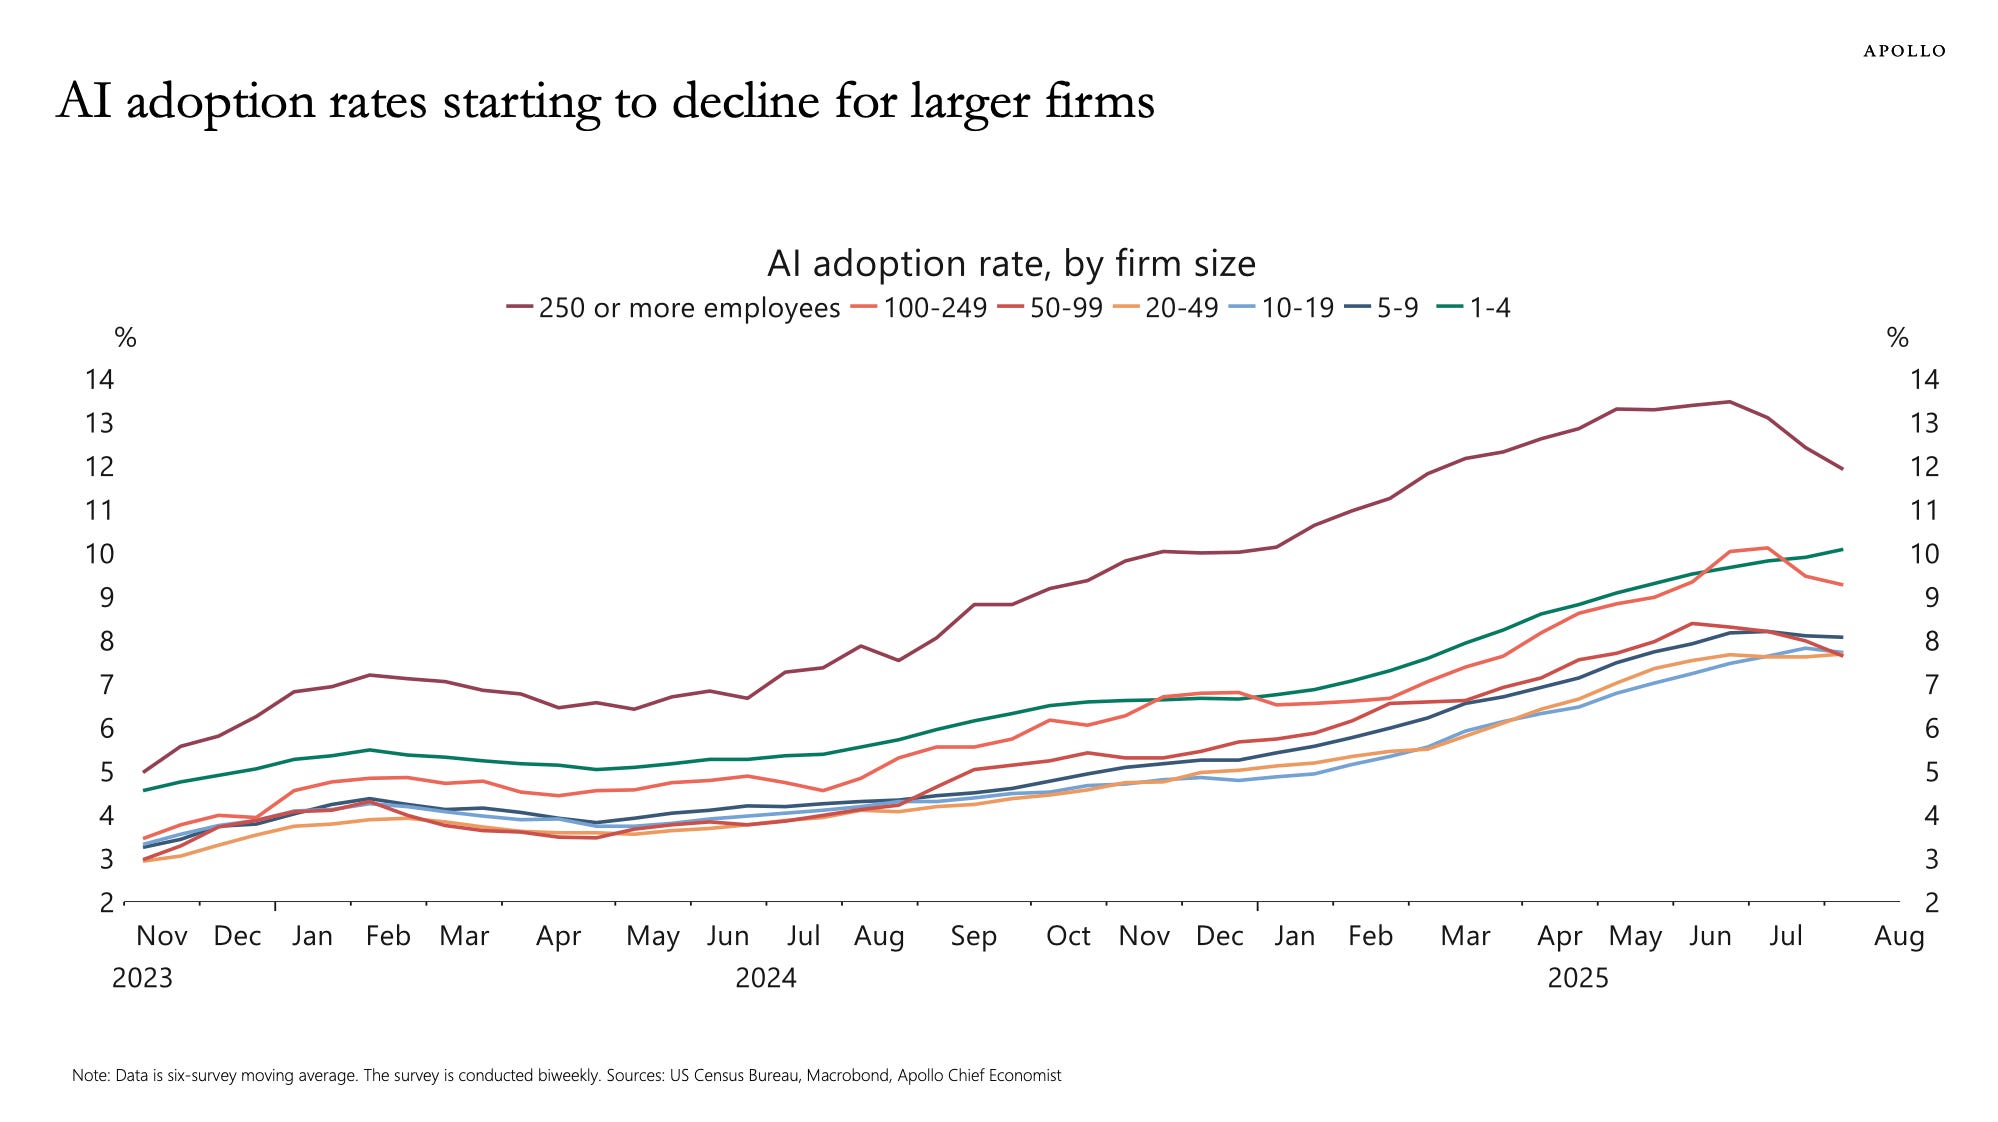
The top-line number looks scary. It clearly shows a dip in AI adoption for companies with 250+ employees, dropping from a peak of around 14% to 12%.
On the surface, it looks bad. The biggest companies, the ones with the deepest pockets, are seemingly pulling back. But as we discussed last week, the headline number is rarely the real story.
When you dig into how this data was collected, the whole thing falls apart.
Cracks in the Data Foundation
This isn't a solid foundation for a strategy; it's a house of cards.
Here's why:
A Question from a Museum: The survey asks businesses if they "use Artificial Intelligence (AI) to produce goods or services?". It then gives examples like "machine learning, natural language processing, virtual agents...". Notice what's missing? Any mention of modern generative AI. This question is a fossil from the pre-ChatGPT era, which happens to be the fastest-growing tech product in history.
A Tiny, Noisy Sample: Here’s the killer. The fraction of U.S. companies with more than 250 employees is tiny, only about 0.4-0.5%. Given typical response rates, the actual sample size for this group could be as low as 100 companies in any given survey period. The margin of error on a sample that small is about 2.8% (after a rolling average). The "decline" from 14% to 12%? That 2-point drop is
statistically meaningless. It’s not a trend; it's noise well within the margin of error.
Just based on this, you could dismiss the chart. But that’s not the real gist.
Where the Real AI Gold Rush Is
So how do we find the real signal in all this noise?
This is the brilliant part of Paul Kedrosky's breakdown.
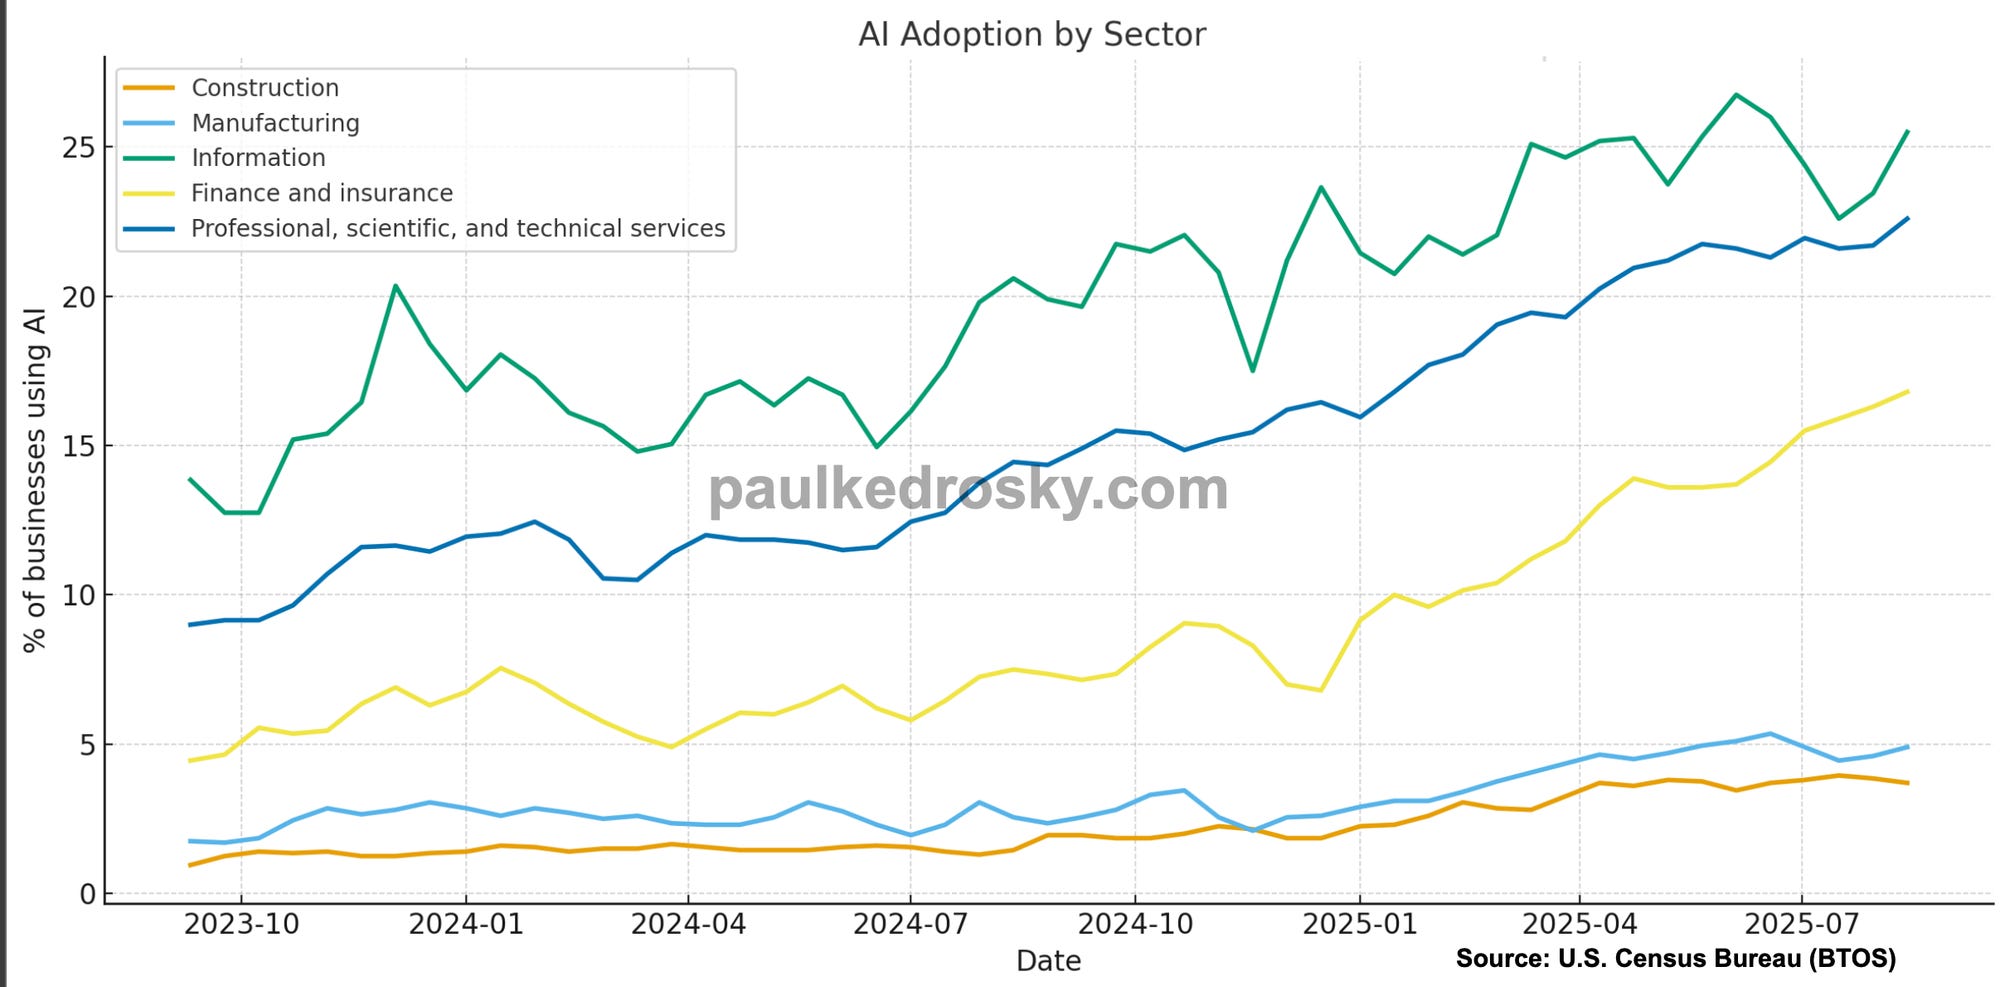
He gets around the sampling errors by slicing the data a different way: not by company size, but by sector. And when you do that, the picture completely flips.
AI adoption is sharply increasing across most sectors.
So what’s causing the illusion of a decline?
Two specific, slow-moving industries:
Construction and Manufacturing. These sectors have the lowest AI adoption rates, and they just so happen to make up a massive chunk —as much as 40%— of all companies in that "250+ employees" category.
This is a classic case of;
Simpson's Paradox: a phenomenon where a trend appears in several different groups of data but disappears or reverses when these groups are combined. The poor performance of these two large sectors is skewing the entire dataset for large companies, making the whole group look like it's declining even when most individual sectors within it are growing.
Focus on Micro-Opportunities
The lesson here is simple but powerful: Stop chasing macro-trends and start hunting for micro-opportunities.
The herd will see the headline chart and pivot away from AI. They’ll say the easy money has been made. Let them.
The smart founders —the people in this community— will see the real story. The AI boom is not slowing down; in fact, as the data shows, it's advancing sharply in most companies.
The opportunity isn’t in selling generic AI to a Fortune 500 manufacturing giant. It’s in building specialized AI tools for the sectors that are actually growing like crazy: finance, professional services, information, healthcare, you name it.
Ignore the noise. The AI boom is not slowing down; it’s specializing. The data proves it.
My entire focus at Next Big App is on finding these hidden opportunities and building the AI-driven micro-products that serve them.
Now, I'll turn it over to you.
What widely-believed "trend" in our industry do you think is another Simpson's Paradox in disguise?